


Understanding Today’s S&P 500 P/E Ratio and What It Tells Us About the Market
The S&P 500 P/E ratio, or Price-to-Earnings ratio, is one of the most common ways to measure how expensive or inexpensive the stock market looks. It compares the average stock price to the earnings per share for the 500 largest U.S. companies.
As of this writing, the S&P 500’s trailing 12-month P/E ratio is about 28.8, according to FactSet and MacroMicro. That’s well above its 5-year and 10-year averages. In simple terms, investors are paying more for every dollar of profit than they typically have in the past. The question is why. Before we address that, let’s look a little deeper.
At its core, the P/E ratio shows how much investors are willing to pay for each dollar a company earns. If the P/E is 20, you’re paying $20 for every $1 of profit. A higher P/E generally means investors are feeling optimistic and expect companies to keep growing.
Right now, with the S&P 500 near 29 times earnings, valuations are clearly stretched. In fact, the last time the market stayed this elevated for a long period was during the late 1990s tech boom when excitement over the internet drove prices far beyond actual profits, and we know how that enthusiasm ended. The market went through a difficult period as the dot-com bubble burst. It resulted in investors losing approximately $5 trillion in market capitalization, primarily from the collapse of the Nasdaq stock index, which fell by over 75% from its March 2000 peak by October 2002. This dramatic decline erased the significant gains made during the speculative boom of the late 1990s, leading to the failure of many internet-based companies.
What Lessons Can We Learn from History
Once expectations outpace reality, the risk rises quickly. Although the internet continued to grow long after the dot-com bust, the stock market faced serious setbacks as trillions of dollars poured out and investors suffered major financial losses. It took the NASDAQ nearly 15 years to fully recover.
The excitement today centers on artificial intelligence. Investors are again paying a premium for the promise of future growth, with the belief that innovation will continue to reshape the economy. This conviction has lifted prices faster than profits. And while optimism isn’t unreasonable, it does come with risk. History doesn’t defy us. It reminds us.
Forward P/E versus Current P/E
While the current or trailing P/E measures actual profits over the past year, the forward P/E ratio looks at projected earnings over the next twelve months. This matters because investors make decisions based on where they think earnings are headed, not just where they’ve been. Thus, the forward P/E shows what investors expect to happen next. The forward P/E is currently around 23 as of this writing.
A lower forward P/E might sound reassuring at first, but it doesn’t necessarily mean stocks are cheaper. It means investors are betting that earnings will rise enough to justify today’s higher prices. That assumption can hold if profits grow at a healthy pace, but if those projections fall short, valuations can quickly look expensive again.
When both the current and forward P/E ratios remain elevated, as they are today, it signals a market leaning heavily on confidence. Investors are not just paying for what companies earned, but for what they hope they will earn. That leaves little margin for error. If corporate results disappoint or the economy slows, prices often adjust faster than people expect because the bar was already set so high.
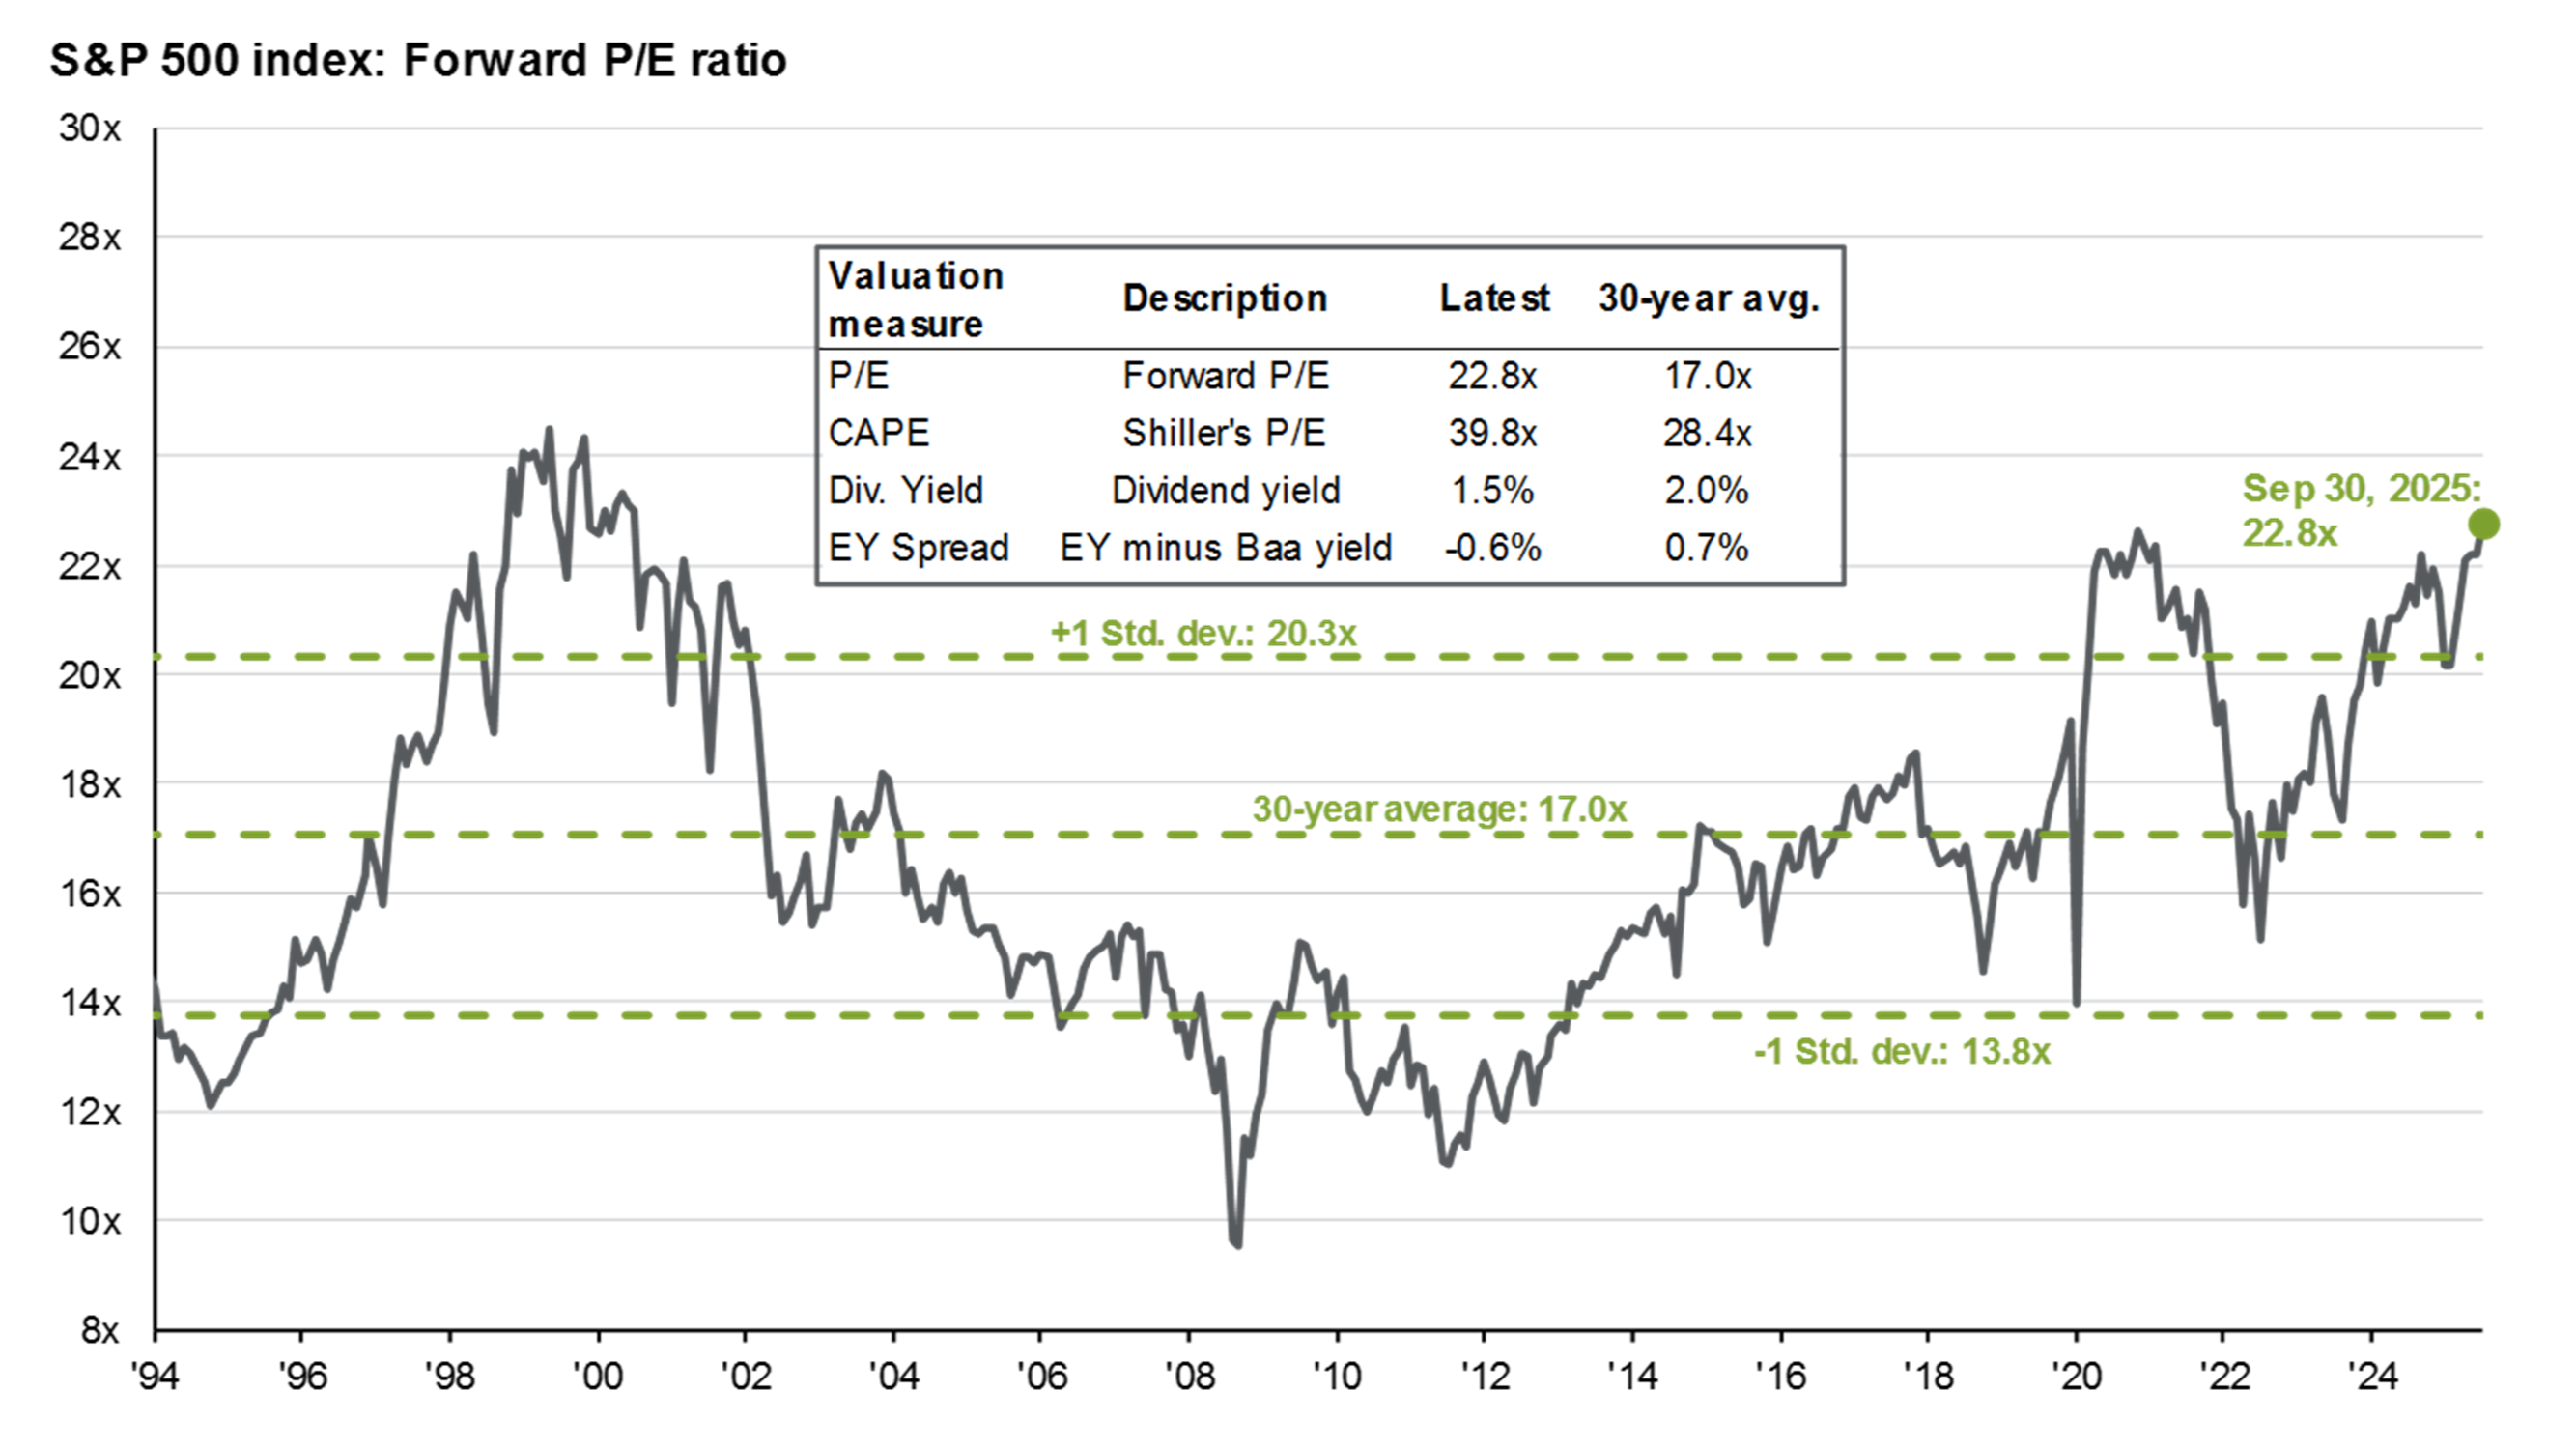
Source: Bloomberg, FactSet, Moody’s, Refinitiv Datastream, Robert Shiller, Standard & Poor’s, J.P. Morgan Asset Management. Forward P/E ratio is the most recent S&P 500 index price divided by consensus analyst estimates for earnings in the next 12 months, provided by IBES since March 1994 and FactSet since January 2022. Shiller’s P/E uses trailing 10-years of inflation-adjusted earnings as reported by companies. Dividend yield is calculated as consensus estimates of dividends in the next 12 months, provided by FactSet, divided by the most recent S&P 500 index price. EY minus Baa yield is the forward earnings yield (the inverse of the forward P/E ratio) minus the Bloomberg U.S. corporate Baa yield since December 2008 and interpolated using the Moody’s Baa seasoned corporate bond yield for values beforehand.
The chart provided by our friends at JP Morgan tells an important story about where valuations stand today. The forward P/E ratio for the S&P 500 is well above its 30-year average of about 17. In fact, over the past three decades, the market has only spent brief periods this far above average, most notably during the late 1990s tech boom.
The green line shows how far current valuations have moved beyond what’s typical. We’re now sitting roughly one full standard deviation above the long-term norm, which is a level that historically hasn’t lasted long. Each time valuations have climbed this high, the market eventually needed stronger earnings to catch up or prices corrected to bring ratios back in line. The higher the ratio, the greater the reliance on things going right.
It’s important to understand that today’s P/E ratio doesn’t mean the market is about to fall, but it does remind us that expectations are running high. Investors are paying more for future earnings than usual, and that means there’s less room for disappointment if growth slows or profits miss the mark. When those expectations are too optimistic, the market becomes more vulnerable to disappointment.
But It’s Different This Time
Legendary investor Sir John Templeton once said that the four most dangerous words in investing are “This time it’s different.” His point was simple but timeless. Every generation of investors finds a reason to believe the old rules no longer apply, whether it was radio stocks in the 1920s, the Nifty Fifty in the 1970s, dot-coms in the 1990s, or now, artificial intelligence in the 2020s.
Templeton’s wisdom reminds us that while innovation always changes the world, human behavior in markets rarely does. The idea that “this time it’s different” usually shows up near market peaks, when confidence is high and people convince themselves that new technology, new data, or a new economy will justify ever-higher prices. History shows that it never really works out that way for long.
A common rebuttal when talking about high valuations is that today’s companies are different. They’re not the start-ups of the dot-com era. They’re global leaders with solid balance sheets, large cash reserves, and real earnings. That’s true. Companies like Apple, Microsoft, and NVIDIA are far more established than Pets.com or Webvan ever were. But that doesn’t eliminate risk.
History reminds us that even the strongest companies can become overvalued when optimism runs too high. A similar story played out in the early 1970s with what became known as the Nifty Fifty. These were blue-chip stocks like Coca-Cola, IBM, Kodak, Avon, and General Electric that investors viewed as untouchable. Many people were willing to pay almost any price for them because they were considered “can’t-miss” companies. Eventually, that confidence pushed valuations to extremes. When the market adjusted, many of those same stocks lost more than half their value. Not because they stopped being great companies, but because prices had climbed too far ahead of profits.
That’s the key lesson. Even when innovation is real and companies are strong, the price you pay matters. The market fell after the dot-com boom not because the world wide web failed but because companies weren’t able to keep up with expectations. The same principle applies today. Artificial intelligence may transform industries just as the internet did, but that doesn’t mean every company tied to it will grow fast enough to justify current prices. Strong companies can weather downturns better, but they’re not immune from bubbles. When prices rise faster than earnings, even the titans can stumble.
Yes, the companies leading this market are stronger and more profitable than the speculative names of the dot-com era, but valuations can still stretch beyond what even great businesses can sustain. I’m reminded of a client who told me, in 2007, that her house would never fall in value because she was on a golf course.
Templeton’s words serve as a reminder that disciplined investing isn’t about predicting what’s next, it’s about respecting what history has already taught us.
A P/E near 29 doesn’t automatically mean the market is in trouble, but it is a test of discipline. This is not the time for complacency or unnecessary risk. It is a time to be prudent. At Longevity Capital Management, we believe markets build wealth for investors who stay focused, patient, and disciplined. Paper profits can go as quickly as they come, but practicing sound principles stand the test of time.